Overview of this project
Delve into the Dashboard's Analysis in this section.
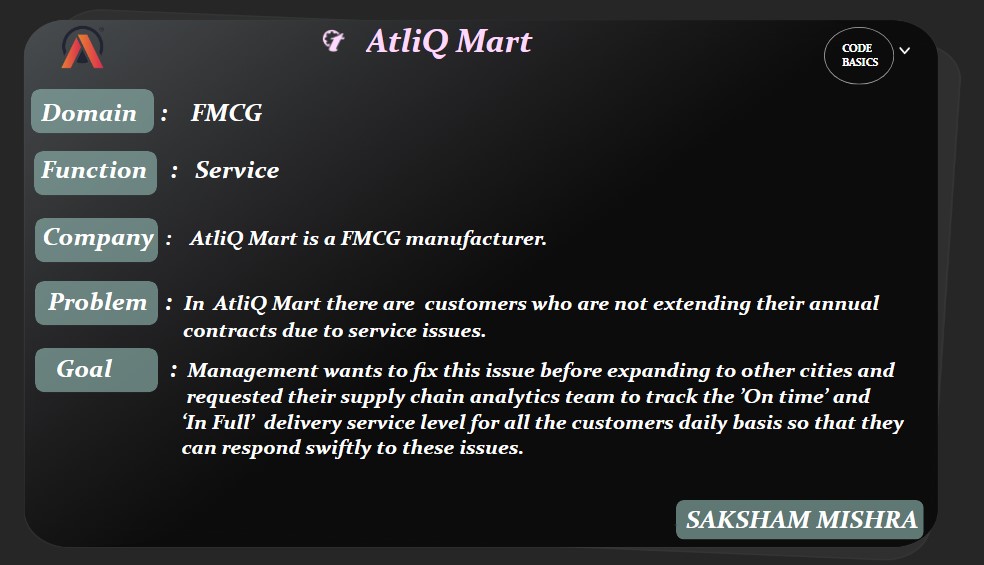
I worked on an exciting project analyzing AtliQ Mart, a fast-moving consumer goods (FMCG) manufacturer operating in three cities: Surat, Ahmedabad, and Vadodara.
1. Utilized SQL to analyze and format table data effectively. 2. Leveraged Power BI for creating impactful visualizations.
During the project, I focused on deriving valuable insights that provided a comprehensive understanding of the business.
- Total Order Lines.
- Analyzed the daily order lines, categorizing them by cities and customers.
- Line Fill Rate:
- Assessed the line fill rate to determine the percentage of completed order lines.
- Volume Fill Rate:
- Evaluated the volume fill rate to measure the percentage of fulfilled order quantities.
- On-Time Delivery Percentage:
- Calculated the on-time delivery percentage in relation to set targets, considering different cities and customers.
- In Full Delivery Percentage:
- Examined the percentage of orders delivered completely as per the targets, categorized by cities and customers.
- On-Time In Full Percentage:
- Determined the percentage of orders delivered on time and in full, with respect to the targets, considering different cities and customers.
In addition, I also provided valuable product insights to further enhance the understanding of the business.
During the creation of the dashboard, I followed a meticulous ideation process to ensure an impactful and user-friendly design.
Here are the steps I took:
I successfully accomplished these objectives and was pleased with the final results, creating a dashboard that effectively communicated the data story
Delve into the Dashboard's Analysis in this section.

Gain insights from the Dashboard's comprehensive analysis in this section.
More about Project