Overall Analysis
Explore the Dashboard's Performance Analysis in this section.
More about Project AtliQ Hardware is a company that supplies computer hardware and peripherals to various clients across India, including Excel Stores and Nomad Stores.
The Sales Director, faces challenges in tracking sales and gaining valuable insights into the business due to the dynamically growing market.
The management wants to fix this issue, the Sales Director wanted to incorporate “Business and Data Intelligence” to regain their market share and revenue.
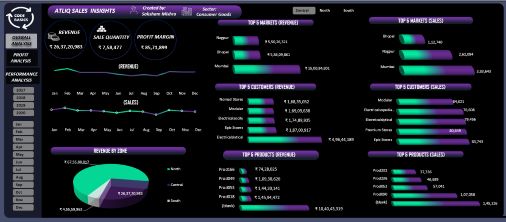
- Regional Revenue Analysis:
- The North region outperforms all other regions, generating a significant revenue of 67.5 Crore. On the other hand, the South region is experiencing challenges, with only 4.5 Crore in revenue, indicating an opportunity for improvement.
- Market Focus in Delhi NCR:
- Delhi NCR emerges as the top-performing market, contributing a substantial revenue of 51 Crore. This highlights the importance of targeting and capitalizing on the opportunities within the Delhi NCR region.
- Profit Margins Comparison:
- The North region boasts the highest profit margin, reaching an impressive 1.5 Crore. Conversely, the South region struggles with the lowest profit margin, at just 10 Lakh. This underscores the need to analyze and address the factors affecting profit margins in the South region.
- Sales Performance by Region:
- With a sales figure of 12 lakh, the North region secures the highest sales volume among all regions. In contrast, the central region lags behind with sales of 7 Lakhs, indicating an area for potential growth and strategic attention.
- Outstanding Customer: Electrical Sara Stores:
- Among all customers, Electrical Sara Stores stands out as the best performer, generating a substantial revenue of 41 Crore and achieving sales of 6.5 lakhs. This highlights the significance of nurturing and leveraging relationships with high-performing customers.
I used the following skills to manipulate the data and create the dashboard:
Explore the Dashboard's Performance Analysis in this section.
More about Project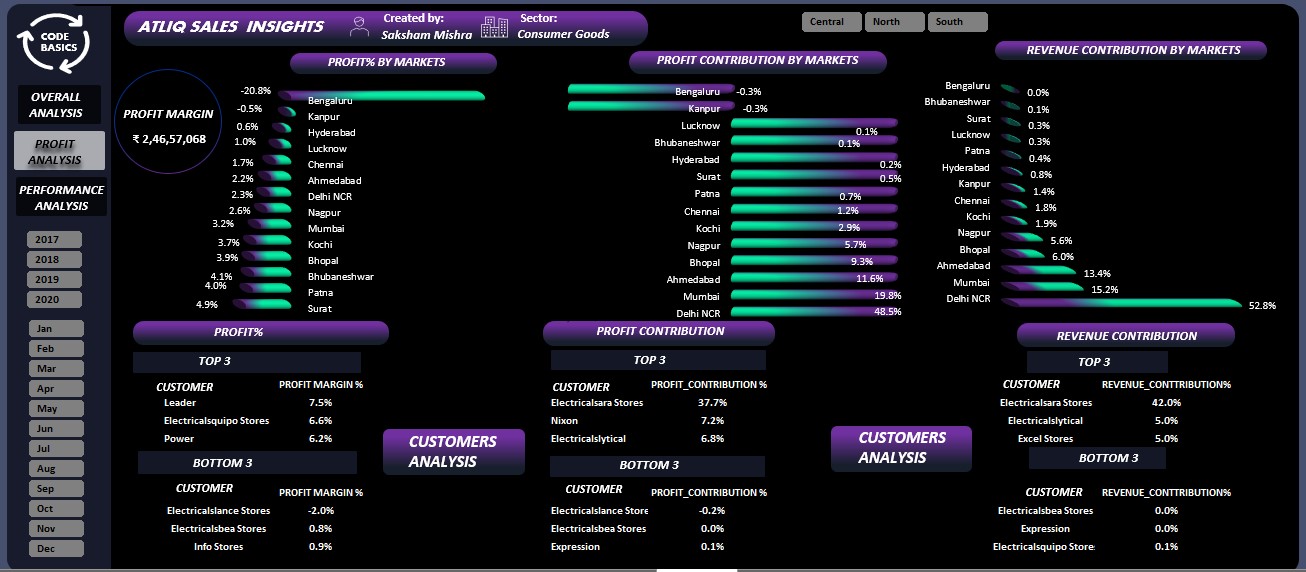
Delve into the Dashboard's Profit Analysis in this section.
More about Project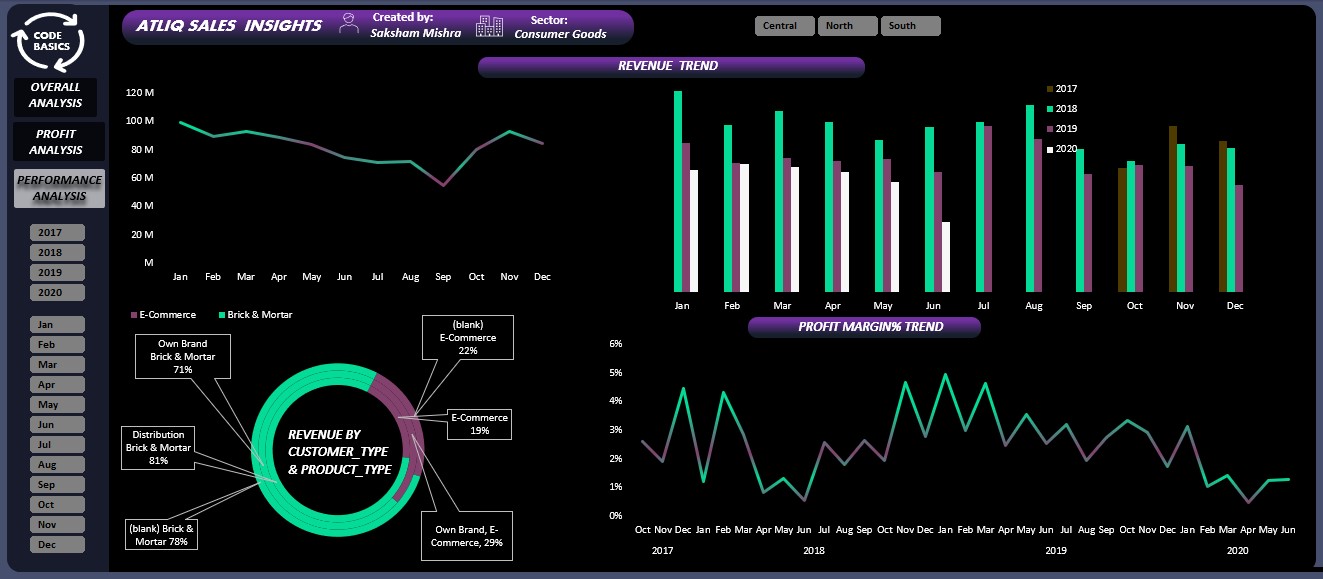
Gain insights from the Dashboard's comprehensive analysis in this section.
More about Project